13/3/11

What Your Computer Does While You Wait

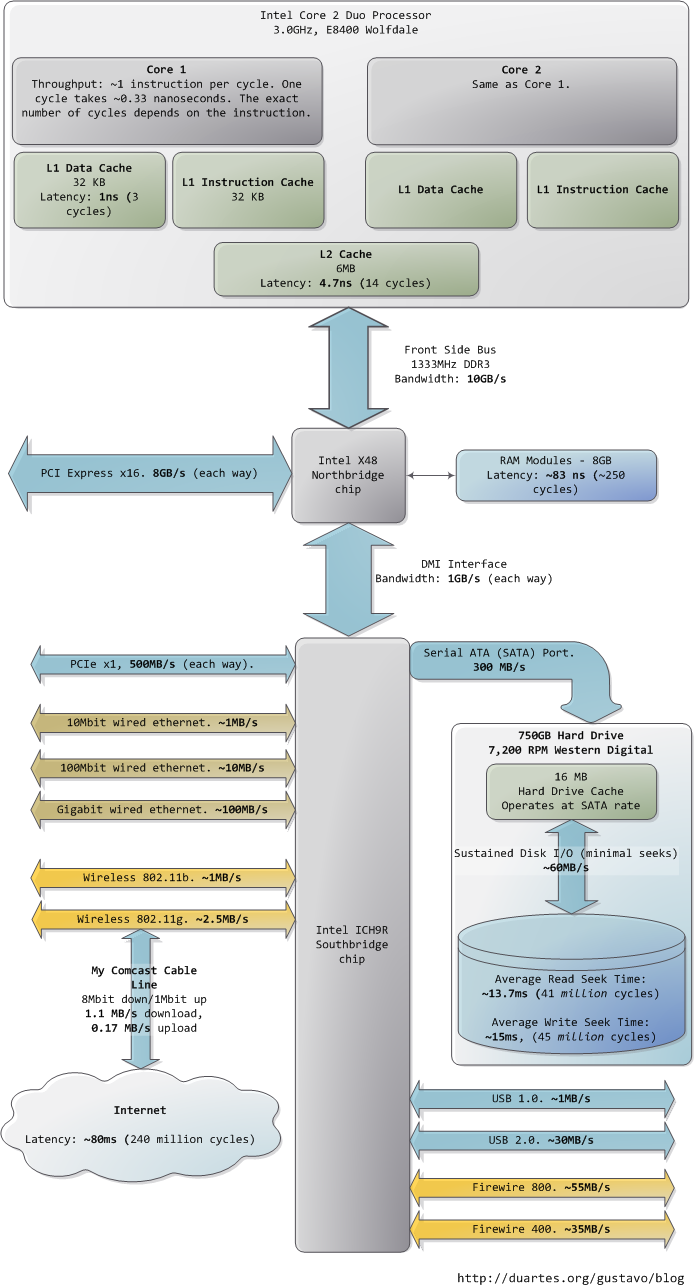
This post takes a look at the speed – latency and throughput – of various subsystems in a modern commodity PC, an Intel Core 2 Duo at 3.0GHz. I hope to give a feel for the relative speed of each component and a cheatsheet for back-of-the-envelope performance calculations. I’ve tried to show real-world throughputs (the sources are posted as a comment) rather than theoretical maximums. Time units are nanoseconds (ns, 10-9 seconds), milliseconds (ms, 10-3 seconds), and seconds (s). Throughput units are in megabytes and gigabytes per second. Let’s start with CPU and memory, the north of the Northbridge:
Latency and Throughput North
The first thing that jumps out is how absurdly fast our processors are. Most simple instructions on the Core 2 take one clock cycle to execute, hence a third of a nanosecond at 3.0Ghz. For reference, light only travels ~4 inches (10 cm) in the time taken by a clock cycle. It’s worth keeping this in mind when you’re thinking of optimization – instructions are comically cheap to execute nowadays.

As the CPU works away, it must read from and write to system memory, which it accesses via the L1 and L2 caches. The caches use static RAM, a much faster (and expensive) type of memory than the DRAM memory used as the main system memory. The caches are part of the processor itself and for the pricier memory we get very low latency. One way in which instruction-level optimization is still very relevant is code size. Due to caching, there can be massive performance differences between code that fits wholly into the L1/L2 caches and code that needs to be marshalled into and out of the caches as it executes.

Normally when the CPU needs to touch the contents of a memory region they must either be in the L1/L2 caches already or be brought in from the main system memory. Here we see our first major hit, a massive ~250 cycles of latency that often leads to a stall, when the CPU has no work to do while it waits. To put this into perspective, reading from L1 cache is like grabbing a piece of paper from your desk (3 seconds), L2 cache is picking up a book from a nearby shelf (14 seconds), and main system memory is taking a 4-minute walk down the hall to buy a Twix bar.

The exact latency of main memory is variable and depends on the application and many other factors. For example, it depends on the CAS latency and specifications of the actual RAM stick that is in the computer. It also depends on how successful the processor is at prefetching – guessing which parts of memory will be needed based on the code that is executing and having them brought into the caches ahead of time.

Looking at L1/L2 cache performance versus main memory performance, it is clear how much there is to gain from larger L2 caches and from applications designed to use it well. For a discussion of all things memory, see Ulrich Drepper’s What Every Programmer Should Know About Memory (pdf), a fine paper on the subject.

People refer to the bottleneck between CPU and memory as the von Neumann bottleneck. Now, the front side bus bandwidth, ~10GB/s, actually looks decent. At that rate, you could read all of 8GB of system memory in less than one second or read 100 bytes in 10ns. Sadly this throughput is a theoretical maximum (unlike most others in the diagram) and cannot be achieved due to delays in the main RAM circuitry. Many discrete wait periods are required when accessing memory. The electrical protocol for access calls for delays after a memory row is selected, after a column is selected, before data can be read reliably, and so on. The use of capacitors calls for periodic refreshes of the data stored in memory lest some bits get corrupted, which adds further overhead. Certain consecutive memory accesses may happen more quickly but there are still delays, and more so for random access. Latency is always present.

Down in the Southbridge we have a number of other buses (e.g., PCIe, USB) and peripherals connected:
Latency and Throughput South
Sadly the Southbridge hosts some truly sluggish performers, for even main memory is blazing fast compared to hard drives. Keeping with the office analogy, waiting for a hard drive seek is like leaving the building to roam the earth for one year and three months. This is why so many workloads are dominated by disk I/O and why database performance can drive off a cliff once the in-memory buffers are exhausted. It is also why plentiful RAM (for buffering) and fast hard drives are so important for overall system performance.

While the “sustained” disk throughput is real in the sense that it is actually achieved by the disk in real-world situations, it does not tell the whole story. The bane of disk performance are seeks, which involve moving the read/write heads across the platter to the right track and then waiting for the platter to spin around to the right position so that the desired sector can be read. Disk RPMs refer to the speed of rotation of the platters: the faster the RPMs, the less time you wait on average for the rotation to give you the desired sector, hence higher RPMs mean faster disks. A cool place to read about the impact of seeks is the paper where a couple of Stanford grad students describe the Anatomy of a Large-Scale Hypertextual Web Search Engine (pdf).

When the disk is reading one large continuous file it achieves greater sustained read speeds due to the lack of seeks. Filesystem defragmentation aims to keep files in continuous chunks on the disk to minimize seeks and boost throughput. When it comes to how fast a computer feels, sustained throughput is less important than seek times and the number of random I/O operations (reads/writes) that a disk can do per time unit. Solid state disks can make for a great option here.

Hard drive caches also help performance. Their tiny size – a 16MB cache in a 750GB drive covers only 0.002% of the disk – suggest they’re useless, but in reality their contribution is allowing a disk to queue up writes and then perform them in one bunch, thereby allowing the disk to plan the order of the writes in a way that – surprise – minimizes seeks. Reads can also be grouped in this way for performance, and both the OS and the drive firmware engage in these optimizations.

Finally, the diagram has various real-world throughputs for networking and other buses. Firewire is shown for reference but is not available natively in the Intel X48 chipset. It’s fun to think of the Internet as a computer bus. The latency to a fast website (say, google.com) is about 45ms, comparable to hard drive seek latency. In fact, while hard drives are 5 orders of magnitude removed from main memory, they’re in the same magnitude as the Internet. Residential bandwidth still lags behind that of sustained hard drive reads, but the ‘network is the computer’ in a pretty literal sense now. What happens when the Internet is faster than a hard drive?

I hope this diagram is useful. It’s fascinating for me to look at all these numbers together and see how far we’ve come. Sources are posted as a comment. I posted a full diagram showing both North and South bridges here if you’re interested.

Comments
EDIT: updated 3/23/2009

Instruction and L1/L2 latencies come from Intel’s Optimization Reference Manual.
DMI speed is from Intel’s datasheet on the chipset shown in the diagram, which you can find here.
Front side bus bandwidth is from Ulrich Drepper’s paper and common knowledge of the FSB.

The hardest bit of info in the diagram is actually the RAM latency. I looked at several of Drepper’s experiments to decide on ~250 cycles. I believe this is a fair number,
close to real-world situations, but reality is much more complicated than a single value conveys. TLB is ignored as well in this post.

SATA bandwidth from Wikipedia.

Hard drive I/O specs from Storage Review.

Firewire and USB 2.0 speed: http://www.barefeats.com/usb2.html,http://www.firewire-1394.com/firewire-vs-usb.htm

USB 1.0: http://www.tomshardware.com/reviews/step,449-7.html

It’s hard to find comprehensive information for Ethernet speeds. Andre went into detail in a great comment below on why many of the speeds we see posted online are too slow. He also posted results from a netio run for his network. Some slower speeds (with a Windows bias, hence hampered by SMB) can be found in:
http://www.ezlan.net/net_speed.html
http://www.ezlan.net/giga.html
http://www.hanselman.com/blog/WiringTheHouseForAHomeNetworkPart5GigabitThroughputAndVista.aspx
As per Scott Hanselman’s post,Jumbo frames can make a big difference in Gigabit performance, boosting throughput by as much as 100%.
These bus and network throughput values match up with rules of thumb I often see in the trenches. If you know of more thorough benchmarks corroborating or contradicting anything, please let me know. Thanks!

Great post Gustavo, keep up the good work!
The L2 cache can catch you out when working on large data structures. I remember when L2 caches were 4MB getting caught out scaling images for a texture mapped game. Once the images approached 4MB in size the performance dropped of a cliff. I know that now the GPU does a lot of this scaling and heavy-lifting for you but the principle when managing any large structure is the same.

This is a great compilation of memory hierarchy performance numbers. One word of caution though—you mix in the numbers for latency and bandwidth, which might lead a superficial reader to confuse the effect of the two. Bandwidth is the crucial one, because if it’s not adequate, there’s nothing you can do.

Latency, on the other hand, can be remediated: even though bad latency can kill a good bandwidth, caching/prefetching or amortization over large transfers can mask it out. Unfortunately, those techniques assume specific
data access patterns, and if those assumptions fail, latency becomes a problem. This leads to a circular trap in system design: the access pattern
has to be well characterized for a successful latency remediation, so that
only programs with ‘conforming’ access pattern run well on this system. Paradoxically, the better-optimized systems penalize weird and non-standard access patterns even more.
Gigabit Ethernet is a good example: 1 Gbps is a great peak bandwidth, but the actual practical bandwidth is much lower, due to relatively short packets (you quote 30 MBps instead of expected 100 megabytes/sec). The actual number for a stupid protocol (e.g. synchronous exchange of short packets) would be much smaller and probably not much faster than 100baseT, because it would have been dominated by packet send/receive latency.

Great post. Think I found a typo:
“Now, the front side bus bandwidth, ~10GB/s, actually looks decent. At that rate, you could read all of 8GB of system memory under 10 seconds or read 100 bytes in 10ns.” Shouldn’t that only take 1 second (or less) to read all of main memory, not 10s (in theory)?

The comment

“… but in reality their contribution is allowing a disk to queue up writes and then perform them in one bunch, thereby allowing the disk to plan the order of the writes in a way that – surprise – minimizes seeks. Reads can also be grouped in this way for performance, and both the OS and the drive firmware engage in these optimizations.”
Is misleading. Actually Native Command Queuing (NCQ) (the re-ordering to minimize seeks) is only available on certain hard drives (some SATA, SAS and SCSI). Also, NCQ improves performance when the disk requests are some what random. For example multiple users accessing different files on a network fileshare. It does not improve performance on desktop system that is running only one or two applications. In fact it might slow things down a bit because applications may be delayed by the optimization that minimizes seek times at the expensive of getting data to the application.

> Residential bandwidth still lags behind that of sustained
> hard drive reads, but the ‘network is the computer’ in a
> pretty literal sense now. What happens when the Internet
> is faster than a hard drive?
Perhaps not on a home PC, but in any datacenter worth the name, roundtrip to the next rack over is already faster than hitting disk. With lots of spindles (ie, database hosts) you can still get greater sustained throughput locally, but for very latency-sensitive applications it’s at the point now that the cheapest way to get 90 gigs of low-latency storage is a three hosts with 32G of RAM running memcached.
I don’t imagine it will be long before you can run applications out of S3 as fast as off your local disk. “Cloud computing” is a stupid term, but that doesn’t mean the underlying idea is wrong.

First I’d suggest labeling every number with Peak or observed, there’s a large difference. I’d also suggest any time you mention latency or bandwidth, that you mention the complimentary value as well. So if you mention 83ns of observed latency, mention both the observed bandwidth and the peak bandwidth (1333 MHz * 128 bits)=20.8GB/sec. For devices where random is significantly different than sequential access I’d suggest mentioning both numbers. So sequential and random for memory, and sequential and random for disk.
The throughput of 1 instruction per cycle is particularly bad, it can vary significantly higher and hugely lower based on what you are doing. Maybe mention the peak, and then the issue rate for a particular workload or benchmark?
Bandwidth would be interesting and useful for the caches.
FSB and RAM isn’t the same thing. They often run at different speeds, and of course the mentioned DDR is connected to the Northbridge not the FSB. So remove DDR3 from the FSB description.
For a real world memory bandwidth number I’d suggest McCalpin’s stream benchmark (ask google).
The PCI-e numbers you quote are for version 2.0, probably worth mentioning that. The usual PCI-e is 1/2 as fast.
If you are going to mention 83ns of memory latency, I’d mention the bandwidth as well (see stream above).
The disk again you should mention peak (from the specification for the drive) and observed. Keep in mind that reading say 1GB from a disk will vary often by a factor of 2 based on where you read the file. I bought a cheap 320GB disk drive gets 50MB/sec or so on the inside of the disk, and 115MB/sec on the outside.
GIG-e easily manages 90+ MB/sec, without Jumbo frames, of course that assumes an OS that does networking reasonably well. Linux does as do many others, you just have to be careful not to be disk limited.
If you need help collecting some of these numbers let me know.
Of course a related diagram for the Core i7 would be very interesting as well.

@b: Absolutely. 99% of the time you want the cleanest, simplest code you can possible write. In a few hotspots, which you discover by PROFILING the code rather than guessing, you optimize for performance if it’s really called for.
@Jason: When I looked for benchmarks, I found a lot of folks capping out at 30MB/s, 40MB/s for gigabit ethernet. Certainly though OS, protocol, and network gear makes a difference. Do you have some benchmarks handy for gigabit ethernet?
@lrbell: thanks for the suggestion. I’ll keep USB 3.0 in mind when it’s time to update this thing.
@SirPwn4g3: that’s cool, I have not been overclocking lately, but I used to enjoy it a ton. Just no time
@zenium: this conflicts with the knowledge I have regarding the buffering behavior of disks. I may well be wrong, but I’d appreciate if you could point me to some resources covering this stuff.
When it comes to apps being delayed, true if the OS is doing it, certainly there is room for different I/O scheduling strategies depending on usage, which is what the Linux kernel offers. But this does not apply to the write back cache since the disk accepts the writes immediately and then proceeds to do them in a seek-minimizing way.
@BB: yep, totally agreed. That’s why I said residential there, in a data center or even LAN there are a lot of interesting possibilities. I am into memcached and other RAM solutions as well.
@Dan: I’m going to mention this in the post. Do you have any idea of how average throughputs work out? Most of the benchmarks I found were well below 90MB/s. I’d love more benchmarks on this.
@Billamama: thanks for the suggestion. I’ll queue this up in the !ideas.txt here
@Mike: you might want to try some Sysinternals tools (now Microsoft tools since they were bought out). They shed light into a look of questions like this for Windows.
@Nick: totally ok with me. I have however posted a combined diagram, which I linked to in the last sentence of the article. Feel free to use my materials, I appreciate a link back though or mention of where it came from.
@kryzstoff: HAH, funny you should mention this I’m a Tufte fan and I had all sorts of fancy plans for the diagrams, for example I had thought of:
1. Making widths proportional to throughput. Maybe lengths.
2. Making the DISTANCES proportional to latency.
Given the brutal order-of-magnitude differences I experimented with a log scale and so on. But in the end, it looked like crap hahah and I don’t think it conveyed much So I went for simple simple. I’m sure a more talented person could come up with a way to make it work though.
@Filipe: hey, check the last paragraph, I have a link to the combined image
@Carlos: exactly, compression on the disk is definitely an interesting side effect of all this stuff.
@Sithdartha: It’s Consolas 9pt in Visio 2007. I also set Visio to “Higher quality text display” under Tools > Options > View.
@Bill: thank you for the suggestions. You make a number of good points, but I need to work some of the information in a way that still keeps the diagrams simple and readable. There are tradeoffs involved, some of which pertain to the target audience and the appropriate level of detail. I appreciate the offer for help, I may write you with a couple of question when I find some time to work on the blog.
Again, thanks everybody for all the kind comments and feedback. It’s great to be able to help out however minimally.
Take care.

Great article. I just want to part with these wise words:
Bandwith you can buy, latency is defined by nature.

Hi Alex,
Thanks a ton for the feedback.
That’s a good point you bring up. In a server environment with lots of tasks going on, it is true that you might have workloads that keep the CPU busy by a combination of multiple processes / decent balance between I/O and CPU usage.
In fact, top notch data centers always aim for that, to come up with workloads that keep the processor busy, since efficiency/money and efficiency/electricity is a big concern and idle hardware is money down the drain.
However, I often see servers where what you describe IS the case – the CPUs are always idling whereas the disks are very busy. Sometimes the server is dog slow – due to I/O – while the CPU is barely breaking 25% usage (one core out of four).
So I think modern systems _indeed_ became horribly inefficient. This million-cycle business is terrible. I think that’s why Jeremy Zawodny said the post “made him sad”.
We need to improve this. Maybe SSDs, maybe something else, but something’s gotta give. CPU stalls due to disk are now catastrophic.
Nice to see you again

Good article.
It matches other things I’ve been reading. This pyramid of latency and the corresponding trends will have a profound impact on how we program.
Here are some more pointers on recent computer trends: http://blog.monstuff.com/archives/000333.htmlIn particular, one of the direct consequences on the numbers you present above is that any large data processing needs to read from the disk sequentially (no seeks), like tapes. That’s the design behind Google MapReduce, Hadoop and Cosmos/Dryad: http://www.lexemetech.com/2008/03/disks-have-become-tapes.html

Computer Builders’ Friday – The “Core” Upgrade[...] Things to look out for You will want to make sure that the pin type matches between the motherboard and CPU. For instance, an LGA 1366 pin Core i7 CPU must be put onto a LGA 1366 pin motherboard. In terms of price point, be aware that small amounts of frequency increase (e.g. between 2.4GHz and 2.63GHz) are not worth the extra $$. A larger number of cores and amount of L2 cache, however, is worth it. Many know the benefits of quad and even hexa-core processors already, but L2 cache is the second-in-line memory bank your system hits and is about 20x less latency than regular DDR RAM (Gustavo Duarte). [...] Sphere: Related Content

Getting Physical With Memory

When trying to understand complex systems, you can often learn a lot by stripping away abstractions and looking at their lowest levels. In that spirit we take a look at memory and I/O ports in their simplest and most fundamental level: the interface between the processor and bus. These details underlie higher level topics like thread synchronization and the need for the Core i7. Also, since I’m a programmer I ignore things EE people care about. Here’s our friend the Core 2 again:
Physical Memory Access
A Core 2 processor has 775 pins, about half of which only provide power and carry no data. Once you group the pins by functionality, the physical interface to the processor is surprisingly simple. The diagram shows the key pins involved in a memory or I/O port operation: address lines, data pins, and request pins. These operations take place in the context of a transaction on the front side bus. FSB transactions go through 5 phases: arbitration, request, snoop, response, and data. Throughout these phases, different roles are played by the components on the FSB, which are called agents. Normally the agents are all the processors plus the Northbridge.

We only look at the request phase in this post, in which 2 packets are output by the request agent, who is usually a processor. Here are the juiciest bits of the first packet, output by the address and request pins:
FSB Request Phase PacketA
The address lines output the starting physical memory address for the transaction. We have 33 bits but they are interpreted as bits 35-3 of an address in which bits 2-0 are zero. Hence we have a 36-bit address, aligned to 8 bytes, for a total of 64GB addressable physical memory. This has been the case since the Pentium Pro. The request pins specify what type of transaction is being initiated; in I/O requests the address pins specify an I/O port rather than a memory address. After the first packet is output, the same pins transmit a second packet in the subsequent bus clock cycle:
FSB Request Phase PacketB
The attribute signals are interesting: they reflect the 5 types of memory caching behavior available in Intel processors. By putting this information on the FSB, the request agent lets other processors know how this transaction affects their caches, and how the memory controller (northbridge) should behave. The processor determines the type of a given memory region mainly by looking at page tables, which are maintained by the kernel.

Typically kernels treat all RAM memory as write-back, which yields the best performance. In write-back mode the unit of memory access is the cache line, 64 bytes in the Core 2. If a program reads a single byte in memory, the processor loads the whole cache line that contains that byte into the L2 and L1 caches. When a program writes to memory, the processor only modifies the line in the cache, but does not update main memory. Later, when it becomes necessary to post the modified line to the bus, the whole cache line is written at once. So most requests have 11 in their length field, for 64 bytes. Here’s a read example in which the data is not in the caches:
Memory Read
Some of the physical memory range in an Intel computer is mapped to devices like hard drives and network cards instead of actual RAM memory. This allows drivers to communicate with their devices by writing to and reading from memory. The kernel marks these memory regions as uncacheable in the page tables. Accesses to uncacheable memory regions are reproduced in the bus exactly as requested by a program or driver. Hence it’s possible to read or write single bytes, words, and so on. This is done via the byte enable mask in packet B above.

The primitives discussed here have many implications. For example:
1. Performance-sensitive applications should try to pack data that is accessed together into the same cache line. Once the cache line is loaded, further reads are much faster and extra RAM accesses are avoided.
2. Any memory access that falls within a single cache line is guaranteed to be atomic (assuming write-back memory). Such an access is serviced by the processor’s L1 cache and the data is read or written all at once; it cannot be affected halfway by other processors or threads. In particular, 32-bit and 64-bit operations that don’t cross cache line boundaries are atomic.
3. The front bus is shared by all agents, who must arbitrate for bus ownership before they can start a transaction. Moreover, all agents must listen to all transactions in order to maintain cache coherence. Thus bus contention becomes a severe problem as more cores and processors are added to Intel computers. The Core i7 solves this by having processors attached directly to memory and communicating in a point-to-point rather than broadcast fashion.

These are the highlights of physical memory requests; the bus will surface again later in connection with locking, multi-threading, and cache coherence. The first time I saw FSB packet descriptions I had a huge “ahhh!” moment so I hope someone out there gets the same benefit. In the next post we’ll go back up the abstraction ladder to take a thorough look at virtual memory. Sphere: Related Content

Cache: a place for concealment and safekeeping

This post shows briefly how CPU caches are organized in modern Intel processors. Cache discussions often lack concrete examples, obfuscating the simple concepts involved. Or maybe my pretty little head is slow. At any rate, here’s half the story on how a Core 2 L1 cache is accessed:
L1 Cache Example
The unit of data in the cache is the line, which is just a contiguous chunk of bytes in memory. This cache uses 64-byte lines. The lines are stored in cache banks or ways, and each way has a dedicated directory to store its housekeeping information. You can imagine each way and its directory as columns in a spreadsheet, in which case the rows are the sets. Then each cell in the way column contains a cache line, tracked by the corresponding cell in the directory. This particular cache has 64 sets and 8 ways, hence 512 cells to store cache lines, which adds up to 32KB of space.

In this cache’s view of the world, physical memory is divided into 4KB physical pages. Each page has 4KB / 64 bytes == 64 cache lines in it. When you look at a 4KB page, bytes 0 through 63 within that page are in the first cache line, bytes 64-127 in the second cache line, and so on. The pattern repeats for each page, so the 3rd line in page 0 is different than the 3rd line in page 1.

In a fully associative cache any line in memory can be stored in any of the cache cells. This makes storage flexible, but it becomes expensive to search for cells when accessing them. Since the L1 and L2 caches operate under tight constraints of power consumption, physical space, and speed, a fully associative cache is not a good trade off in most scenarios.

Instead, this cache is set associative, which means that a given line in memory can only be stored in one specific set (or row) shown above. So the first line of any physical page (bytes 0-63 within a page) must be stored in row 0, the second line in row 1, etc. Each row has 8 cells available to store the cache lines it is associated with, making this an 8-way associative set. When looking at a memory address, bits 11-6 determine the line number within the 4KB page and therefore the set to be used. For example, physical address 0x800010a0 has 000010 in those bits so it must be stored in set 2.

But we still have the problem of finding which cell in the row holds the data, if any. That’s where the directory comes in. Each cached line is tagged by its corresponding directory cell; the tag is simply the number for the page where the line came from. The processor can address 64GB of physical RAM, so there are 64GB / 4KB == 224 of these pages and thus we need 24 bits for our tag. Our example physical address 0x800010a0 corresponds to page number 524,289. Here’s the second half of the story:
Selecting Cache Line
Since we only need to look in one set of 8 ways, the tag matching is very fast; in fact, electrically all tags are compared simultaneously, which I tried to show with the arrows. If there’s a valid cache line with a matching tag, we have a cache hit. Otherwise, the request is forwarded to the L2 cache, and failing that to main system memory. Intel builds large L2 caches by playing with the size and quantity of the ways, but the design is the same. For example, you could turn this into a 64KB cache by adding 8 more ways. Then increase the number of sets to 4096 and each way can store 256KB. These two modifications would deliver a 4MB L2 cache. In this scenario, you’d need 18 bits for the tags and 12 for the set index; the physical page size used by the cache is equal to its way size.

If a set fills up, then a cache line must be evicted before another one can be stored. To avoid this, performance-sensitive programs try to organize their data so that memory accesses are evenly spread among cache lines. For example, suppose a program has an array of 512-byte objects such that some objects are 4KB apart in memory. Fields in these objects fall into the same lines and compete for the same cache set. If the program frequently accesses a given field (e.g., the vtable by calling a virtual method), the set will likely fill up and the cache will start trashing as lines are repeatedly evicted and later reloaded. Our example L1 cache can only hold the vtables for 8 of these objects due to set size. This is the cost of the set associativity trade-off: we can get cache misses due to set conflicts even when overall cache usage is not heavy. However, due to the relative speeds in a computer, most apps don’t need to worry about this anyway.

A memory access usually starts with a linear (virtual) address, so the L1 cache relies on the paging unit to obtain the physical page address used for the cache tags. By contrast, the set index comes from the least significant bits of the linear address and is used without translation (bits 11-6 in our example). Hence the L1 cache is physically tagged but virtually indexed, helping the CPU to parallelize lookup operations. Because the L1 way is never bigger than an MMU page, a given physical memory location is guaranteed to be associated with the same set even with virtual indexing. L2 caches, on the other hand, must be physically tagged and physically indexed because their way size can be bigger than MMU pages. But then again, by the time a request gets to the L2 cache the physical address was already resolved by the L1 cache, so it works out nicely.

Finally, a directory cell also stores the state of its corresponding cached line. A line in the L1 code cache is either Invalid or Shared (which means valid, really). In the L1 data cache and the L2 cache, a line can be in any of the 4 MESI states: Modified, Exclusive, Shared, or Invalid. Intel caches are inclusive: the contents of the L1 cache are duplicated in the L2 cache. These states will play a part in later posts about threading, locking, and that kind of stuff. Next time we’ll look at the front side bus and how memory access really works. This is going to be memory week.

Update: Dave brought up direct-mapped caches in a comment below. They’re basically a special case of set-associative caches that have only one way. In the trade-off spectrum, they’re the opposite of fully associative caches: blazing fast access, lots of conflict misses. Sphere: Related Content

Page Cache, the Affair Between Memory and Files

Previously we looked at how the kernel manages virtual memory for a user process, but files and I/O were left out. This post covers the important and often misunderstood relationship between files and memory and its consequences for performance.

Two serious problems must be solved by the OS when it comes to files. The first one is the mind-blowing slowness of hard drives, and disk seeks in particular, relative to memory. The second is the need to load file contents in physical memory once and share the contents among programs. If you use Process Explorer to poke at Windows processes, you’ll see there are ~15MB worth of common DLLs loaded in every process. My Windows box right now is running 100 processes, so without sharing I’d be using up to ~1.5 GB of physical RAM just for common DLLs. No good. Likewise, nearly all Linux programs need ld.so and libc, plus other common libraries.

Happily, both problems can be dealt with in one shot: the page cache, where the kernel stores page-sized chunks of files. To illustrate the page cache, I’ll conjure a Linux program named render, which opens file scene.dat and reads it 512 bytes at a time, storing the file contents into a heap-allocated block. The first read goes like this:
Read from Page Cache
After 12KB have been read, render‘s heap and the relevant page frames look thus:
Non-Mapped File Read
This looks innocent enough, but there’s a lot going on. First, even though this program uses regular read calls, three 4KB page frames are now in the page cache storing part of scene.dat. People are sometimes surprised by this, but all regular file I/O happens through the page cache. In x86 Linux, the kernel thinks of a file as a sequence of 4KB chunks. If you read a single byte from a file, the whole 4KB chunk containing the byte you asked for is read from disk and placed into the page cache. This makes sense because sustained disk throughput is pretty good and programs normally read more than just a few bytes from a file region. The page cache knows the position of each 4KB chunk within the file, depicted above as #0, #1, etc. Windows uses 256KB views analogous to pages in the Linux page cache.

Sadly, in a regular file read the kernel must copy the contents of the page cache into a user buffer, which not only takes cpu time and hurts the cpu caches, but also wastes physical memory with duplicate data. As per the diagram above, the scene.dat contents are stored twice, and each instance of the program would store the contents an additional time. We’ve mitigated the disk latency problem but failed miserably at everything else. Memory-mapped files are the way out of this madness:
Mapped File Read
When you use file mapping, the kernel maps your program’s virtual pages directly onto the page cache. This can deliver a significant performance boost: Windows System Programming reports run time improvements of 30% and up relative to regular file reads, while similar figures are reported for Linux and Solaris in Advanced Programming in the Unix Environment. You might also save large amounts of physical memory, depending on the nature of your application.

As always with performance, measurement is everything, but memory mapping earns its keep in a programmer’s toolbox. The API is pretty nice too, it allows you to access a file as bytes in memory and does not require your soul and code readability in exchange for its benefits. Mind your address space and experiment with mmap in Unix-like systems, CreateFileMapping in Windows, or the many wrappers available in high level languages. When you map a file its contents are not brought into memory all at once, but rather on demand via page faults. The fault handler maps your virtual pages onto the page cache after obtaining a page frame with the needed file contents. This involves disk I/O if the contents weren’t cached to begin with.

Now for a pop quiz. Imagine that the last instance of our render program exits. Would the pages storing scene.dat in the page cache be freed immediately? People often think so, but that would be a bad idea. When you think about it, it is very common for us to create a file in one program, exit, then use the file in a second program. The page cache must handle that case. When you think more about it, why should the kernel ever get rid of page cache contents? Remember that disk is 5 orders of magnitude slower than RAM, hence a page cache hit is a huge win. So long as there’s enough free physical memory, the cache should be kept full. It is therefore not dependent on a particular process, but rather it’s a system-wide resource. If you run render a week from now and scene.dat is still cached, bonus! This is why the kernel cache size climbs steadily until it hits a ceiling. It’s not because the OS is garbage and hogs your RAM, it’s actually good behavior because in a way free physical memory is a waste. Better use as much of the stuff for caching as possible.

Due to the page cache architecture, when a program calls write() bytes are simply copied to the page cache and the page is marked dirty. Disk I/O normally does not happen immediately, thus your program doesn’t block waiting for the disk. On the downside, if the computer crashes your writes will never make it, hence critical files like database transaction logs must be fsync()ed (though one must still worry about drive controller caches, oy!). Reads, on the other hand, normally block your program until the data is available. Kernels employ eager loading to mitigate this problem, an example of which is read ahead where the kernel preloads a few pages into the page cache in anticipation of your reads. You can help the kernel tune its eager loading behavior by providing hints on whether you plan to read a file sequentially or randomly (see madvise(), readahead(), Windows cache hints). Linux does read-ahead for memory-mapped files, but I’m not sure about Windows. Finally, it’s possible to bypass the page cache using O_DIRECT in Linux or NO_BUFFERING in Windows, something database software often does.

A file mapping may be private or shared. This refers only to updates made to the contents in memory: in a private mapping the updates are not committed to disk or made visible to other processes, whereas in a shared mapping they are. Kernels use the copy on write mechanism, enabled by page table entries, to implement private mappings. In the example below, both render and another program called render3d (am I creative or what?) have mapped scene.dat privately. Render then writes to its virtual memory area that maps the file:
Copy On Write
The read-only page table entries shown above do not mean the mapping is read only, they’re merely a kernel trick to share physical memory until the last possible moment. You can see how ‘private’ is a bit of a misnomer until you remember it only applies to updates. A consequence of this design is that a virtual page that maps a file privately sees changes done to the file by other programs as long as the page has only been read from. Once copy-on-write is done, changes by others are no longer seen. This behavior is not guaranteed by the kernel, but it’s what you get in x86 and makes sense from an API perspective. By contrast, a shared mapping is simply mapped onto the page cache and that’s it. Updates are visible to other processes and end up in the disk. Finally, if the mapping above were read-only, page faults would trigger a segmentation fault instead of copy on write.

Dynamically loaded libraries are brought into your program’s address space via file mapping. There’s nothing magical about it, it’s the same private file mapping available to you via regular APIs. Below is an example showing part of the address spaces from two running instances of the file-mapping render program, along with physical memory, to tie together many of the concepts we’ve seen.
Virtual To Physical Mapping
This concludes our 3-part series on memory fundamentals. I hope the series was useful and provided you with a good mental model of these OS topics. Next week there’s one more post on memory usage figures, and then it’s time for a change of air. Maybe some Web 2.0 gossip or something. Sphere: Related Content

How The Kernel Manages Your Memory

After examining the virtual address layout of a process, we turn to the kernel and its mechanisms for managing user memory. Here is gonzo again:
mm_struct
Linux processes are implemented in the kernel as instances of task_struct, the process descriptor. The mm field in task_struct points to the memory descriptor, mm_struct, which is an executive summary of a program’s memory. It stores the start and end of memory segments as shown above, the number of physical memory pages used by the process (rss stands for Resident Set Size), the amount of virtual address space used, and other tidbits. Within the memory descriptor we also find the two work horses for managing program memory: the set of virtual memory areas and the page tables. Gonzo’s memory areas are shown below:
Memory Descriptor and Memory Areas
Each virtual memory area (VMA is a contiguous range of virtual addresses; these areas never overlap. An instance of vm_area_struct fully describes a memory area, including its start and end addresses, flags to determine access rights and behaviors, and the vm_file field to specify which file is being mapped by the area, if any. A VMA that does not map a file is anonymous. Each memory segment above (e.g., heap, stack) corresponds to a single VMA, with the exception of the memory mapping segment. This is not a requirement, though it is usual in x86 machines. VMAs do not care which segment they are in.

A program’s VMAs are stored in its memory descriptor both as a linked list in the mmap field, ordered by starting virtual address, and as a red-black tree rooted at the mm_rb field. The red-black tree allows the kernel to search quickly for the memory area covering a given virtual address. When you read file /proc/pid_of_process/maps, the kernel is simply going through the linked list of VMAs for the process and printing each one.

In Windows, the EPROCESS block is roughly a mix of task_struct and mm_struct. The Windows analog to a VMA is the Virtual Address Descriptor (VAD); they are stored in an AVL tree. You know what the funniest thing about Windows and Linux is? It’s the little differences.

The 4GB virtual address space is divided into pages. x86 processors in 32-bit mode support page sizes of 4KB, 2MB, and 4MB. Both Linux and Windows map the user portion of the virtual address space using 4KB pages. Bytes 0-4095 fall in page 0, bytes 4096-8191 fall in page 1, and so on. The size of a VMA must be a multiple of page size. Here’s 3GB of user space in 4KB pages:
Paged Virtual Space
The processor consults page tables to translate a virtual address into a physical memory address. Each process has its own set of page tables; whenever a process switch occurs, page tables for user space are switched as well. Linux stores a pointer to a process’ page tables in the pgd field of the memory descriptor. To each virtual page there corresponds one page table entry (PTE) in the page tables, which in regular x86 paging is a simple 4-byte record shown below:
x86 Page Table Entry 4KB
Linux has functions to read and set each flag in a PTE. Bit P tells the processor whether the virtual page is present in physical memory. If clear (equal to 0), accessing the page triggers a page fault. Keep in mind that when this bit is zero, the kernel can do whatever it pleases with the remaining fields. The R/W flag stands for read/write; if clear, the page is read-only. Flag U/S stands for user/supervisor; if clear, then the page can only be accessed by the kernel. These flags are used to implement the read-only memory and protected kernel space we saw before.

Bits D and A are for dirty and accessed. A dirty page has had a write, while an accessed page has had a write or read. Both flags are sticky: the processor only sets them, they must be cleared by the kernel. Finally, the PTE stores the starting physical address that corresponds to this page, aligned to 4KB. This naive-looking field is the source of some pain, for it limits addressable physical memory to 4 GB. The other PTE fields are for another day, as is Physical Address Extension.

A virtual page is the unit of memory protection because all of its bytes share the U/S and R/W flags. However, the same physical memory could be mapped by different pages, possibly with different protection flags. Notice that execute permissions are nowhere to be seen in the PTE. This is why classic x86 paging allows code on the stack to be executed, making it easier to exploit stack buffer overflows (it’s still possible to exploit non-executable stacks using return-to-libc and other techniques). This lack of a PTE no-execute flag illustrates a broader fact: permission flags in a VMA may or may not translate cleanly into hardware protection. The kernel does what it can, but ultimately the architecture limits what is possible.

Virtual memory doesn’t store anything, it simply maps a program’s address space onto the underlying physical memory, which is accessed by the processor as a large block called the physical address space. While memory operations on the bus are somewhat involved, we can ignore that here and assume that physical addresses range from zero to the top of available memory in one-byte increments. This physical address space is broken down by the kernel into page frames. The processor doesn’t know or care about frames, yet they are crucial to the kernel because the page frame is the unit of physical memory management. Both Linux and Windows use 4KB page frames in 32-bit mode; here is an example of a machine with 2GB of RAM:
Physical Address Space
In Linux each page frame is tracked by a descriptor and several flags. Together these descriptors track the entire physical memory in the computer; the precise state of each page frame is always known. Physical memory is managed with the buddy memory allocation technique, hence a page frame is free if it’s available for allocation via the buddy system. An allocated page frame might be anonymous, holding program data, or it might be in the page cache, holding data stored in a file or block device. There are other exotic page frame uses, but leave them alone for now. Windows has an analogous Page Frame Number (PFN) database to track physical memory.

Let’s put together virtual memory areas, page table entries and page frames to understand how this all works. Below is an example of a user heap:
Heap Mapped
Blue rectangles represent pages in the VMA range, while arrows represent page table entries mapping pages onto page frames. Some virtual pages lack arrows; this means their corresponding PTEs have the Present flag clear. This could be because the pages have never been touched or because their contents have been swapped out. In either case access to these pages will lead to page faults, even though they are within the VMA. It may seem strange for the VMA and the page tables to disagree, yet this often happens.

A VMA is like a contract between your program and the kernel. You ask for something to be done (memory allocated, a file mapped, etc.), the kernel says “sure”, and it creates or updates the appropriate VMA. But it does not actually honor the request right away, it waits until a page fault happens to do real work. The kernel is a lazy, deceitful sack of scum; this is the fundamental principle of virtual memory. It applies in most situations, some familiar and some surprising, but the rule is that VMAs record what has been agreed upon, while PTEs reflect what has actually been done by the lazy kernel. These two data structures together manage a program’s memory; both play a role in resolving page faults, freeing memory, swapping memory out, and so on. Let’s take the simple case of memory allocation:
Heap Allocation
When the program asks for more memory via the brk() system call, the kernel simply updates the heap VMA and calls it good. No page frames are actually allocated at this point and the new pages are not present in physical memory. Once the program tries to access the pages, the processor page faults and do_page_fault() is called. It searches for the VMA covering the faulted virtual address using find_vma(). If found, the permissions on the VMA are also checked against the attempted access (read or write). If there’s no suitable VMA, no contract covers the attempted memory access and the process is punished by Segmentation Fault.

When a VMA is found the kernel must handle the fault by looking at the PTE contents and the type of VMA. In our case, the PTE shows the page is not present. In fact, our PTE is completely blank (all zeros), which in Linux means the virtual page has never been mapped. Since this is an anonymous VMA, we have a purely RAM affair that must be handled by do_anonymous_page(), which allocates a page frame and makes a PTE to map the faulted virtual page onto the freshly allocated frame.

Things could have been different. The PTE for a swapped out page, for example, has 0 in the Present flag but is not blank. Instead, it stores the swap location holding the page contents, which must be read from disk and loaded into a page frame by do_swap_page() in what is called a major fault.

This concludes the first half of our tour through the kernel’s user memory management. In the next post, we’ll throw files into the mix to build a complete picture of memory fundamentals, including consequences for performance. Sphere: Related Content

Anatomy of a Program in Memory

Memory management is the heart of operating systems; it is crucial for both programming and system administration. In the next few posts I’ll cover memory with an eye towards practical aspects, but without shying away from internals. While the concepts are generic, examples are mostly from Linux and Windows on 32-bit x86. This first post describes how programs are laid out in memory.

Each process in a multi-tasking OS runs in its own memory sandbox. This sandbox is the virtual address space, which in 32-bit mode is always a 4GB block of memory addresses. These virtual addresses are mapped to physical memory by page tables, which are maintained by the operating system kernel and consulted by the processor. Each process has its own set of page tables, but there is a catch. Once virtual addresses are enabled, they apply to all software running in the machine, including the kernel itself. Thus a portion of the virtual address space must be reserved to the kernel:

Kernel User Memory Split
This does not mean the kernel uses that much physical memory, only that it has that portion of address space available to map whatever physical memory it wishes. Kernel space is flagged in the page tables as exclusive to privileged code (ring 2 or lower), hence a page fault is triggered if user-mode programs try to touch it. In Linux, kernel space is constantly present and maps the same physical memory in all processes. Kernel code and data are always addressable, ready to handle interrupts or system calls at any time. By contrast, the mapping for the user-mode portion of the address space changes whenever a process switch happens:
Virtual Memory-in Process Switch
Blue regions represent virtual addresses that are mapped to physical memory, whereas white regions are unmapped. In the example above, Firefox has used far more of its virtual address space due to its legendary memory hunger. The distinct bands in the address space correspond to memory segments like the heap, stack, and so on. Keep in mind these segments are simply a range of memory addresses and have nothing to do with Intel-style segments. Anyway, here is the standard segment layout in a Linux process:
Linux Flexible Address Space Layout
When computing was happy and safe and cuddly, the starting virtual addresses for the segments shown above were exactly the same for nearly every process in a machine. This made it easy to exploit security vulnerabilities remotely. An exploit often needs to reference absolute memory locations: an address on the stack, the address for a library function, etc. Remote attackers must choose this location blindly, counting on the fact that address spaces are all the same. When they are, people get pwned. Thus address space randomization has become popular. Linux randomizes the stack, memory mapping segment, and heap by adding offsets to their starting addresses. Unfortunately the 32-bit address space is pretty tight, leaving little room for randomization and hampering its effectiveness.

The topmost segment in the process address space is the stack, which stores local variables and function parameters in most programming languages. Calling a method or function pushes a new stack frame onto the stack. The stack frame is destroyed when the function returns. This simple design, possible because the data obeys strict LIFO order, means that no complex data structure is needed to track stack contents – a simple pointer to the top of the stack will do. Pushing and popping are thus very fast and deterministic. Also, the constant reuse of stack regions tends to keep active stack memory in the cpu caches, speeding up access. Each thread in a process gets its own stack.

It is possible to exhaust the area mapping the stack by pushing more data than it can fit. This triggers a page fault that is handled in Linux by expand_stack(), which in turn calls acct_stack_growth() to check whether it’s appropriate to grow the stack. If the stack size is below RLIMIT_STACK (usually 8MB), then normally the stack grows and the program continues merrily, unaware of what just happened. This is the normal mechanism whereby stack size adjusts to demand. However, if the maximum stack size has been reached, we have a stack overflow and the program receives a Segmentation Fault. While the mapped stack area expands to meet demand, it does not shrink back when the stack gets smaller. Like the federal budget, it only expands.

Dynamic stack growth is the only situation in which access to an unmapped memory region, shown in white above, might be valid. Any other access to unmapped memory triggers a page fault that results in a Segmentation Fault. Some mapped areas are read-only, hence write attempts to these areas also lead to segfaults.

Below the stack, we have the memory mapping segment. Here the kernel maps contents of files directly to memory. Any application can ask for such a mapping via the Linux mmap() system call (implementation) or CreateFileMapping() / MapViewOfFile() in Windows. Memory mapping is a convenient and high-performance way to do file I/O, so it is used for loading dynamic libraries. It is also possible to create an anonymous memory mapping that does not correspond to any files, being used instead for program data. In Linux, if you request a large block of memory via malloc(), the C library will create such an anonymous mapping instead of using heap memory. ‘Large’ means larger than MMAP_THRESHOLD bytes, 128 kB by default and adjustable via mallopt().

Speaking of the heap, it comes next in our plunge into address space. The heap provides runtime memory allocation, like the stack, meant for data that must outlive the function doing the allocation, unlike the stack. Most languages provide heap management to programs. Satisfying memory requests is thus a joint affair between the language runtime and the kernel. In C, the interface to heap allocation is malloc() and friends, whereas in a garbage-collected language like C# the interface is the new keyword.

If there is enough space in the heap to satisfy a memory request, it can be handled by the language runtime without kernel involvement. Otherwise the heap is enlarged via the brk() system call (implementation) to make room for the requested block. Heap management is complex, requiring sophisticated algorithms that strive for speed and efficient memory usage in the face of our programs’ chaotic allocation patterns. The time needed to service a heap request can vary substantially. Real-time systems have special-purpose allocators to deal with this problem. Heaps also become fragmented, shown below:
Fragmented Heap
Finally, we get to the lowest segments of memory: BSS, data, and program text. Both BSS and data store contents for static (global) variables in C. The difference is that BSS stores the contents of uninitialized static variables, whose values are not set by the programmer in source code. The BSS memory area is anonymous: it does not map any file. If you say static int cntActiveUsers, the contents of cntActiveUsers live in the BSS.

The data segment, on the other hand, holds the contents for static variables initialized in source code. This memory area is not anonymous. It maps the part of the program’s binary image that contains the initial static values given in source code. So if you say static int cntWorkerBees = 10, the contents of cntWorkerBees live in the data segment and start out as 10. Even though the data segment maps a file, it is a private memory mapping, which means that updates to memory are not reflected in the underlying file. This must be the case, otherwise assignments to global variables would change your on-disk binary image. Inconceivable!

The data example in the diagram is trickier because it uses a pointer. In that case, the contents of pointer gonzo – a 4-byte memory address – live in the data segment. The actual string it points to does not, however. The string lives in the text segment, which is read-only and stores all of your code in addition to tidbits like string literals. The text segment also maps your binary file in memory, but writes to this area earn your program a Segmentation Fault. This helps prevent pointer bugs, though not as effectively as avoiding C in the first place. Here’s a diagram showing these segments and our example variables:
Mapping Binary Image
You can examine the memory areas in a Linux process by reading the file /proc/pid_of_process/maps. Keep in mind that a segment may contain many areas. For example, each memory mapped file normally has its own area in the mmap segment, and dynamic libraries have extra areas similar to BSS and data. The next post will clarify what ‘area’ really means. Also, sometimes people say “data segment” meaning all of data + bss + heap.

You can examine binary images using the nm and objdump commands to display symbols, their addresses, segments, and so on. Finally, the virtual address layout described above is the “flexible” layout in Linux, which has been the default for a few years. It assumes that we have a value for RLIMIT_STACK. When that’s not the case, Linux reverts back to the “classic” layout shown below:
Linux Classic Address SpaceLayout
That’s it for virtual address space layout. The next post discusses how the kernel keeps track of these memory areas. Coming up we’ll look at memory mapping, how file reading and writing ties into all this and what memory usage figures mean.

GUSTAVO DUARTE Comments:
Thank you all for the feedback!
@web dev: The kernel is not really using that much memory physical though, it simply has that virtual range available to itself to map whatever physical memory it wishes. Thanks for the question though – I clarified this in the post.
Both the Linux and Windows kernel are extremely well built. It’s hard to find areas where one really has an edge, imho. Two outstanding pieces of software.
@numerodix: You know, this ‘tightness’ of the address space is a sort of recent phenomenon. When the kernels were designed, 2 or 3GB seemed like a lot So partially it’s an evolutionary artifact, one that is fixed by 64-bit address spaces.
But also, it is good for performance to give the kernel an ample window into memory. I think the next couple posts should clarify why this is.
@Reader1: thanks for the corrections. I’ll add the heap randomization to the post. Regarding ELF sections, I thought about them, but I’m always balancing what to include in these blog posts. I try hard to keep it crisp, covering one area well, but without dumbing anything down. But there’s so much interconnected stuff, it’s not always clear where to put the line. I think I’m going to leave ELF sections out for now though.
@Jose: thanks for the heads up
@el_bot: This is one similar to ELF sections above. The tradeoff between conciseness and completeness. I’m planning a post covering the stack in detail, and talking about buffer overflows, and I think that’d go in well there.
------------------------------------------------------------------------------------
First off, thank you all for the feedback!
It is great to hear that the post helped out a little bit. Contributing to the community is one of the major reasons I write this stuff, though it doesn’t hurt that it’s fun.
@vs: the idea of a book does surface in the comment threads from time to time. I see a few issues though: 1) I want to keep the content free, no matter what; 2) the color would be gone in a normal book; 3) the links would be gone.
Lately I’ve been thinking about maybe collecting all the stuff once there’s enough, and having an online book of sorts. Then maybe make color prints for a small fee if people wanted hard copies (I wouldn’t mind making money on these).
I really had no idea where this blog would go, though now it’s becoming a bit clearer. So yea, I’m munching on it.
@John: you are correct. Basically the set of threads in a thread group share all the memory regions except for the stack and thread-local-storage. Within the kernel, threads are represented with the same data structure used for processes, task_struct, so again you are correct.
Does this help clear it up? I could dig up the relevant links to kernel code if you’d like to see the stuff in action. Let me know.
-----------------------------------------------------------------------------------
[...] Anatomy of a Program in Memory Memory management is the heart of operating systems; it is crucial for both programming and system administration. In the next few posts I’ll cover memory with an eye towards practical aspects, but without shying away from internals. While the concepts are generic, examples are mostly from Linux and Windows on 32-bit x86. This first post describes how programs are laid out in memory. (tags: windows reference programming hardware) [...]
-----------------------------------------------------------------------------------
Interesting arcticle, Very didactly and with figures!! xD … well being a litle bit serious, i think that is very clear and simply to explain the concepts, follow in this way !
pd: for more linux kernel understading, in “viewly” way it will be use kernel profiling, aka “/proc/profile & kerneltop ” very useful to see internal functions and the corresponding behavior of that.
-----------------------------------------------------------------------------------
@Prabhu: that’s a great topic. There’s a good book about this called Linkers and Loaders. It’s from 2000, not sure how much has changed since. I’m going to add this to my write queue, though I have no idea when the post would actually come out
----------------------------------------------------------------------------------
Hi Gustavo, thank you for all your excellent articles.
I have a question, two actually. As you’ve said each thread has its own stack area. How are these stack areas located with respect to each other? e.g if there are two threads in a process T1 & T2 where would their stacks start and end in the memory. The second question is similar. Does each thread has two stacks – one for user mode and one for kernel mode?

@Raminder: Sorry for the delay, I’ve been working a bit lately. Per our email, I’ll talk about Windows only.

I don’t know where in the virtual space the thread stacks go. I googled briefly but didn’t see an answer, so I think the easiest thing to do is to write a short test program to spawn a few threads calling a function that prints the address of a local variable. If you do a loop of 10 or so the pattern should become clear. I found two relevant posts:
http://blogs.msdn.com/oldnewthing/archive/2005/07/29/444912.aspx

http://software.intel.com/en-us/articles/adjusting-thread-stack-address-to-improve-performance-on-intel-xeonr-processors/
Regarding the second question, YES, threads have two stacks: a large one for user mode (1MB by default it looks like) and a tiny one for kernel mode (just a few kilobytes, 12k for x86). The kernel stack is kept in kernel-mode data structures and can’t be touched from user mode.
Hope this helps.
----------------------------------------------------------------------------------
@Alex,
Thanks! That’s right, a process can’t use more than 3GB of RAM. That’s why for example the memcached folks tell you to run multiple instances when your box has more than 3GB running in 32-bit mode with PAE. Regarding the numbers in top, that would be interesting to see. It could be a quirk with the numbers themselves, or it could be that there’s some exception going on – but in general your understanding is correct – processes can’t use more than 3GB.

Regarding the 1GB not being shown in VIRT, it’s because the kernel accounting ignores the kernel space. It’s just a design issue – why worry about it since it’s there for every process? People would be shocked to see /bin/ls running with 1GB of virt space
-----------------------------------------------------------------------------------
maverick said.
great post.. keep up the good work.. have a doubt regarding the memory mapped area for shared libraries..it starts 0×40000000. Does it grow upwards or downwards ? I remember it grows upwards. In your both figures, its drawn differently.

Narayanan said:
Hi, I ve doubt regarding malloc allocting memory. How does malloc stores information about the size of the pointer as free uses only pointer variable as argument and not the size. can u explain which part of address space it is stored..?Thanks in advance…

@maverick: in x86 Linux it grows as shown in the diagrams, but this varies by CPU architecture and kernel.
@Narayanan: Malloc does its own house keeping to know how much was allocated to each pointer. The best place to check this out is reading the libc source code for malloc and free.
---------------------------------------------------------------------------------
Brian said:
Thanks for this post Gustavo. I have a question, though.
I’m mainly a sysadmin, not a low-level developer, but I need to understand this stuff for low-level debugging at the system level. Near the top of this post, you mention “ring 2 or lower” as if we should all just know what that even means, and I’m sorry to say that I do not. Could you point me to a doc that’ll explain that, or could you expand on what this notion of “rings” relates to?
Thanks — all of your posts are top notch.

Hi Brian,
Here you go to: CPU Rings Privilege and Protection
cheers
--------------------------------------------------------------------------------
Great post! Solve tons of doubts of mine.
Though I still have a few questions hope you can clarify for me.
If I understand them right:
1)The kernel stuff of kernel space (1GB) is in the physical memory (1GB) all the time, unless a user process is trying to access the physical memory mapped to kernel space. If that is the case, swapping will happen. Right?
2)So if I only have enough physical memory for kernel mapping, all my user processes will need to use the memory mapped to kernel. So I will have a lot swapping going on. Right?
3)Why 1GB? Is it based on the size of resident processes and other necessary structures? Or is it hardware related?
Thanks in advance!
---------------------------------------------------------------------------------
Nice article. It should be noted that there is a special case: When clone(2) is used instead of fork(2) to create a process, the address mappings are replicated (stack excepted).
----------------------------------------------------------------------------------
It’s not clear which kernel/libc version above information applies to.

For instance, on CentOS 5.3 running a 2.6.18 kernel with Redhat’s patches 2.6.18-128.7.1.el5PAE and GNU libc 2.5, some shared libraries are located beneath the code segment – which contradicts the figure shown above.

> tac /proc/21779/maps
bfeba000-bff0f000 rw-p bffaa000 00:00 0 [stack]
b7f98000-b7f9f000 r–s 00000000 fd:00 36079468 /usr/lib/gconv/gconv-modules.cache
b7f93000-b7f95000 rw-p b7f93000 00:00 0
b7d93000-b7f93000 r–p 00000000 fd:00 36001563 /usr/lib/locale/locale-archive
08ae9000-08b4c000 rw-p 08ae9000 00:00 0 [heap]
0809c000-080f9000 rw-p 0809c000 00:00 0
08098000-0809c000 rw-p 00050000 fd:00 90800216 /bin/tcsh
08047000-08098000 r-xp 00000000 fd:00 90800216 /bin/tcsh
02b4d000-02b4e000 rwxp 00002000 fd:00 95783275 /lib/libtermcap.so.2.0.8
02b4a000-02b4d000 r-xp 00000000 fd:00 95783275 /lib/libtermcap.so.2.0.8
028ac000-028d3000 rwxp 028ac000 00:00 0
028ab000-028ac000 rwxp 00009000 fd:00 95783323 /lib/libcrypt-2.5.so
028aa000-028ab000 r-xp 00008000 fd:00 95783323 /lib/libcrypt-2.5.so
028a1000-028aa000 r-xp 00000000 fd:00 95783323 /lib/libcrypt-2.5.so
0090a000-0090b000 rwxp 00009000 fd:00 95780903 /lib/libnss_files-2.5.so
00909000-0090a000 r-xp 00008000 fd:00 95780903 /lib/libnss_files-2.5.so
00900000-00909000 r-xp 00000000 fd:00 95780903 /lib/libnss_files-2.5.so
008da000-008dc000 rwxp 008da000 00:00 0
008d9000-008da000 rwxp 0000f000 fd:00 95783322 /lib/libresolv-2.5.so
008d8000-008d9000 r-xp 0000e000 fd:00 95783322 /lib/libresolv-2.5.so
008c9000-008d8000 r-xp 00000000 fd:00 95783322 /lib/libresolv-2.5.so
006d4000-006d7000 rwxp 006d4000 00:00 0
006d3000-006d4000 rwxp 00140000 fd:00 95781738 /lib/libc-2.5.so
006d1000-006d3000 r-xp 0013e000 fd:00 95781738 /lib/libc-2.5.so
00593000-006d1000 r-xp 00000000 fd:00 95781738 /lib/libc-2.5.so
00480000-00481000 rwxp 0001a000 fd:00 95780954 /lib/ld-2.5.so
0047f000-00480000 r-xp 00019000 fd:00 95780954 /lib/ld-2.5.so
00465000-0047f000 r-xp 00000000 fd:00 95780954 /lib/ld-2.5.so
00451000-00452000 r-xp 00451000 00:00 0 [vdso]
00115000-00116000 rwxp 00004000 fd:00 95780901 /lib/libnss_dns-2.5.so
00114000-00115000 r-xp 00003000 fd:00 95780901 /lib/libnss_dns-2.5.so
00110000-00114000 r-xp 00000000 fd:00 95780901 /lib/libnss_dns-2.5.so
---------------------------------------------------------------------------------- Sphere: Related Content

How Computers Boot Up

The previous post described motherboards and the memory map in Intel computers to set the scene for the initial phases of boot. Booting is an involved, hacky, multi-stage affair – fun stuff. Here’s an outline of the process:
An outline of the boot sequence

Things start rolling when you press the power button on the computer (no! do tell!). Once the motherboard is powered up it initializes its own firmware – the chipset and other tidbits – and tries to get the CPU running. If things fail at this point (e.g., the CPU is busted or missing) then you will likely have a system that looks completely dead except for rotating fans. A few motherboards manage to emit beeps for an absent or faulty CPU, but the zombie-with-fans state is the most common scenario based on my experience. Sometimes USB or other devices can cause this to happen: unplugging all non-essential devices is a possible cure for a system that was working and suddenly appears dead like this. You can then single out the culprit device by elimination.

If all is well the CPU starts running. In a multi-processor or multi-core system one CPU is dynamically chosen to be the bootstrap processor (BSP) that runs all of the BIOS and kernel initialization code. The remaining processors, called application processors (AP) at this point, remain halted until later on when they are explicitly activated by the kernel. Intel CPUs have been evolving over the years but they’re fully backwards compatible, so modern CPUs can behave like the original 1978 Intel 8086, which is exactly what they do after power up. In this primitive power up state the processor is in real mode with memory paging disabled. This is like ancient MS-DOS where only 1 MB of memory can be addressed and any code can write to any place in memory – there’s no notion of protection or privilege.

Most registers in the CPU have well-defined values after power up, including the instruction pointer (EIP) which holds the memory address for the instruction being executed by the CPU. Intel CPUs use a hack whereby even though only 1MB of memory can be addressed at power up, a hidden base address (an offset, essentially) is applied to EIP so that the first instruction executed is at address 0xFFFFFFF0 (16 bytes short of the end of 4 gigs of memory and well above one megabyte). This magical address is called the reset vector and is standard for modern Intel CPUs.

The motherboard ensures that the instruction at the reset vector is a jump to the memory location mapped to the BIOS entry point. This jump implicitly clears the hidden base address present at power up. All of these memory locations have the right contents needed by the CPU thanks to the memory map kept by the chipset. They are all mapped to flash memory containing the BIOS since at this point the RAM modules have random crap in them. An example of the relevant memory regions is shown below:
Important memory regions during boot

The CPU then starts executing BIOS code, which initializes some of the hardware in the machine. Afterwards the BIOS kicks off the Power-on Self Test (POST) which tests various components in the computer. Lack of a working video card fails the POST and causes the BIOS to halt and emit beeps to let you know what’s wrong, since messages on the screen aren’t an option. A working video card takes us to a stage where the computer looks alive: manufacturer logos are printed, memory starts to be tested, angels blare their horns. Other POST failures, like a missing keyboard, lead to halts with an error message on the screen. The POST involves a mixture of testing and initialization, including sorting out all the resources – interrupts, memory ranges, I/O ports – for PCI devices. Modern BIOSes that follow the Advanced Configuration and Power Interface build a number of data tables that describe the devices in the computer; these tables are later used by the kernel.

After the POST the BIOS wants to boot up an operating system, which must be found somewhere: hard drives, CD-ROM drives, floppy disks, etc. The actual order in which the BIOS seeks a boot device is user configurable. If there is no suitable boot device the BIOS halts with a complaint like “Non-System Disk or Disk Error.” A dead hard drive might present with this symptom. Hopefully this doesn’t happen and the BIOS finds a working disk allowing the boot to proceed.

The BIOS now reads the first 512-byte sector (sector zero) of the hard disk. This is called the Master Boot Record and it normally contains two vital components: a tiny OS-specific bootstrapping program at the start of the MBR followed by a partition table for the disk. The BIOS however does not care about any of this: it simply loads the contents of the MBR into memory location 0x7c00 and jumps to that location to start executing whatever code is in the MBR.
Master Boot Record

The specific code in the MBR could be a Windows MBR loader, code from Linux loaders such as LILO or GRUB, or even a virus. In contrast the partition table is standardized: it is a 64-byte area with four 16-byte entries describing how the disk has been divided up (so you can run multiple operating systems or have separate volumes in the same disk). Traditionally Microsoft MBR code takes a look at the partition table, finds the (only) partition marked as active, loads the boot sector for that partition, and runs that code. The boot sector is the first sector of a partition, as opposed to the first sector for the whole disk. If something is wrong with the partition table you would get messages like “Invalid Partition Table” or “Missing Operating System.” This message does not come from the BIOS but rather from the MBR code loaded from disk. Thus the specific message depends on the MBR flavor.

Boot loading has gotten more sophisticated and flexible over time. The Linux boot loaders Lilo and GRUB can handle a wide variety of operating systems, file systems, and boot configurations. Their MBR code does not necessarily follow the “boot the active partition” approach described above. But functionally the process goes like this:
1.The MBR itself contains the first stage of the boot loader.GRUB calls this stage 1.
2.Due to its tiny size, the code in the MBR does just enough to load another sector from disk that contains additional boostrap code. This sector might be the boot sector for a partition, but could also be a sector that was hard-coded into the MBR code when the MBR was installed.
3.The MBR code plus code loaded in step 2 then read a file containing the second stage of the boot loader. In GRUB this is GRUB Stage 2, and in Windows Server this is c:\NTLDR. If step 2 fails in Windows you’d get a message like “NTLDR is missing”. The stage 2 code then reads a boot configuration file (e.g., grub.conf in GRUB, boot.ini in Windows). It then presents boot choices to the user or simply goes ahead in a single-boot system.
4.At this point the boot loader code needs to fire up a kernel. It must know enough about file systems to read the kernel from the boot partition. In Linux this means reading a file like “vmlinuz-2.6.22-14-server” containing the kernel, loading the file into memory and jumping to the kernel bootstrap code. In Windows Server 2003 some of the kernel start-up code is separate from the kernel image itself and is actually embedded into NTLDR. After performing several initializations, NTDLR loads the kernel image from file c:\Windows\System32\ntoskrnl.exe and, just as GRUB does, jumps to the kernel entry point.
There’s a complication worth mentioning (aka, I told you this thing is hacky). The image for a current Linux kernel, even compressed, does not fit into the 640K of RAM available in real mode. My vanilla Ubuntu kernel is 1.7 MB compressed. Yet the boot loader must run in real mode in order to call the BIOS routines for reading from the disk, since the kernel is clearly not available at that point. The solution is the venerable unreal mode. This is not a true processor mode (I wish the engineers at Intel were allowed to have fun like that), but rather a technique where a program switches back and forth between real mode and protected mode in order to access memory above 1MB while still using the BIOS. If you read GRUB source code, you’ll see these transitions all over the place (look under stage2/ for calls to real_to_prot and prot_to_real). At the end of this sticky process the loader has stuffed the kernel in memory, by hook or by crook, but it leaves the processor in real mode when it’s done.

We’re now at the jump from “Boot Loader” to “Early Kernel Initialization” as shown in the first diagram. That’s when things heat up as the kernel starts to unfold and set things in motion. The next post will be a guided tour through the Linux Kernel initialization with links to sources at the Linux Cross Reference. I can’t do the same for Windows :=) but I’ll point out the highlights.

[Update: cleared up discussion of NTLDR.]


Some comments:

Padraig Brady said:
Nice article thanks. For a grub centric bootup description see this

[...] How Computers Boot Up [...]

This is not how *all* computers boot.
Some use EFI (no BIOS), also ARM based machines have none, neither do pre-Intel Macs.

So… do any of you know the actual origin of ‘bootstrap’? For real: “A convenient loop on the back of a boot, allowing one to ‘easily’ pull on ones own boot.”
The original bootstrap loaders for most mainframe computers before ROM was invented was a single binary punched card containing an 80 byte/word program max that was hardwired to be read into low memory and then a branch to location ’1′ was issued to execute this bootstrap routine which then loaded the remaining binary cards into subsequent regions of memory.
IBM 1401 [early 1960's] only required a single bootstrap card. Honeywell 6000 Series [mid 1970's] needed one card to start, THREE more to provide sufficient logic to load the rest of the bootloader and about 350 more punched cards to provide a basic OS to get the real one loaded off disk! Seemed to take forever when a reboot was in order – actually, about 5 minutes… And now we complain if it takes more than a few seconds.
We have it easy now, just turn it on Sphere: Related Content