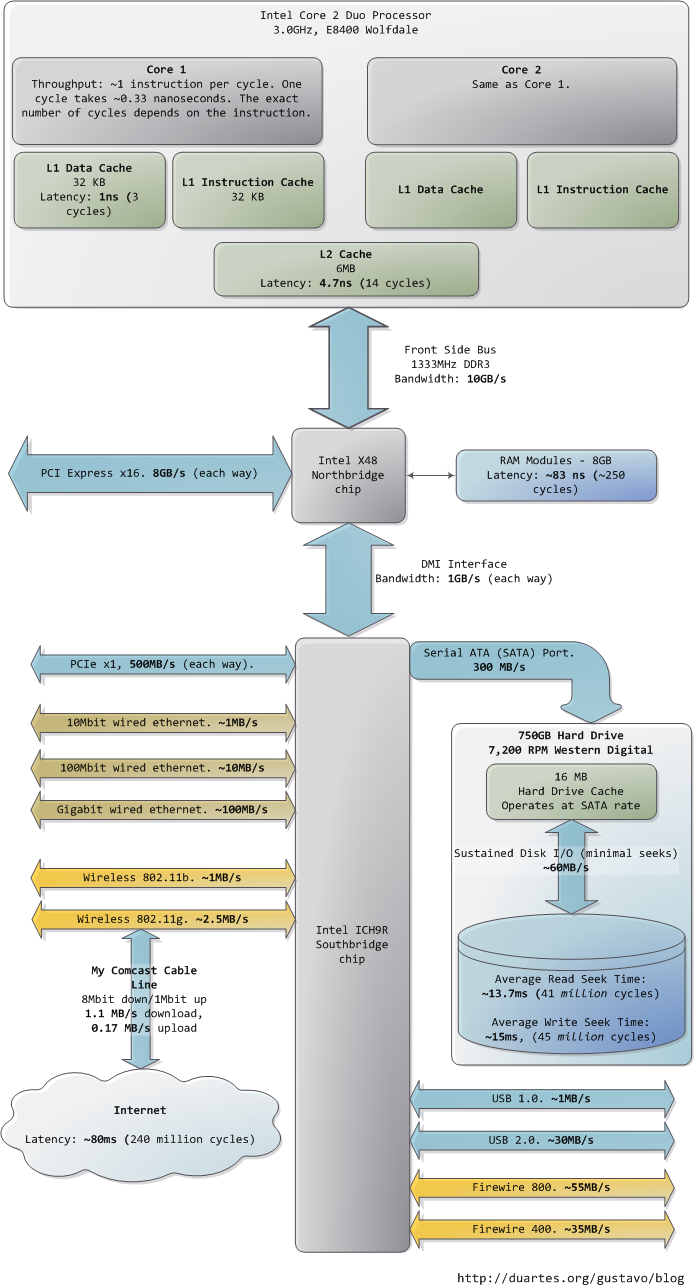
As the CPU works away, it must read from and write to system memory, which it accesses via the L1 and L2 caches. The caches use static RAM, a much faster (and expensive) type of memory than the DRAM memory used as the main system memory. The caches are part of the processor itself and for the pricier memory we get very low latency. One way in which instruction-level optimization is still very relevant is code size. Due to caching, there can be massive performance differences between code that fits wholly into the L1/L2 caches and code that needs to be marshalled into and out of the caches as it executes.
Normally when the CPU needs to touch the contents of a memory region they must either be in the L1/L2 caches already or be brought in from the main system memory. Here we see our first major hit, a massive ~250 cycles of latency that often leads to a stall, when the CPU has no work to do while it waits. To put this into perspective, reading from L1 cache is like grabbing a piece of paper from your desk (3 seconds), L2 cache is picking up a book from a nearby shelf (14 seconds), and main system memory is taking a 4-minute walk down the hall to buy a Twix bar.
The exact latency of main memory is variable and depends on the application and many other factors. For example, it depends on the CAS latency and specifications of the actual RAM stick that is in the computer. It also depends on how successful the processor is at prefetching – guessing which parts of memory will be needed based on the code that is executing and having them brought into the caches ahead of time.
Looking at L1/L2 cache performance versus main memory performance, it is clear how much there is to gain from larger L2 caches and from applications designed to use it well. For a discussion of all things memory, see Ulrich Drepper’s What Every Programmer Should Know About Memory (pdf), a fine paper on the subject.
People refer to the bottleneck between CPU and memory as the von Neumann bottleneck. Now, the front side bus bandwidth, ~10GB/s, actually looks decent. At that rate, you could read all of 8GB of system memory in less than one second or read 100 bytes in 10ns. Sadly this throughput is a theoretical maximum (unlike most others in the diagram) and cannot be achieved due to delays in the main RAM circuitry. Many discrete wait periods are required when accessing memory. The electrical protocol for access calls for delays after a memory row is selected, after a column is selected, before data can be read reliably, and so on. The use of capacitors calls for periodic refreshes of the data stored in memory lest some bits get corrupted, which adds further overhead. Certain consecutive memory accesses may happen more quickly but there are still delays, and more so for random access. Latency is always present.
Down in the Southbridge we have a number of other buses (e.g., PCIe, USB) and peripherals connected:

While the “sustained” disk throughput is real in the sense that it is actually achieved by the disk in real-world situations, it does not tell the whole story. The bane of disk performance are seeks, which involve moving the read/write heads across the platter to the right track and then waiting for the platter to spin around to the right position so that the desired sector can be read. Disk RPMs refer to the speed of rotation of the platters: the faster the RPMs, the less time you wait on average for the rotation to give you the desired sector, hence higher RPMs mean faster disks. A cool place to read about the impact of seeks is the paper where a couple of Stanford grad students describe the Anatomy of a Large-Scale Hypertextual Web Search Engine (pdf).
When the disk is reading one large continuous file it achieves greater sustained read speeds due to the lack of seeks. Filesystem defragmentation aims to keep files in continuous chunks on the disk to minimize seeks and boost throughput. When it comes to how fast a computer feels, sustained throughput is less important than seek times and the number of random I/O operations (reads/writes) that a disk can do per time unit. Solid state disks can make for a great option here.
Hard drive caches also help performance. Their tiny size – a 16MB cache in a 750GB drive covers only 0.002% of the disk – suggest they’re useless, but in reality their contribution is allowing a disk to queue up writes and then perform them in one bunch, thereby allowing the disk to plan the order of the writes in a way that – surprise – minimizes seeks. Reads can also be grouped in this way for performance, and both the OS and the drive firmware engage in these optimizations.
Finally, the diagram has various real-world throughputs for networking and other buses. Firewire is shown for reference but is not available natively in the Intel X48 chipset. It’s fun to think of the Internet as a computer bus. The latency to a fast website (say, google.com) is about 45ms, comparable to hard drive seek latency. In fact, while hard drives are 5 orders of magnitude removed from main memory, they’re in the same magnitude as the Internet. Residential bandwidth still lags behind that of sustained hard drive reads, but the ‘network is the computer’ in a pretty literal sense now. What happens when the Internet is faster than a hard drive?
I hope this diagram is useful. It’s fascinating for me to look at all these numbers together and see how far we’ve come. Sources are posted as a comment. I posted a full diagram showing both North and South bridges here if you’re interested.
Comments
EDIT: updated 3/23/2009
Instruction and L1/L2 latencies come from Intel’s Optimization Reference Manual.
DMI speed is from Intel’s datasheet on the chipset shown in the diagram, which you can find here.
Front side bus bandwidth is from Ulrich Drepper’s paper and common knowledge of the FSB.
The hardest bit of info in the diagram is actually the RAM latency. I looked at several of Drepper’s experiments to decide on ~250 cycles. I believe this is a fair number,
close to real-world situations, but reality is much more complicated than a single value conveys. TLB is ignored as well in this post.
SATA bandwidth from Wikipedia.
Hard drive I/O specs from Storage Review.
Firewire and USB 2.0 speed: http://www.barefeats.com/usb2.html,http://www.firewire-1394.com/firewire-vs-usb.htm
USB 1.0: http://www.tomshardware.com/reviews/step,449-7.html
It’s hard to find comprehensive information for Ethernet speeds. Andre went into detail in a great comment below on why many of the speeds we see posted online are too slow. He also posted results from a netio run for his network. Some slower speeds (with a Windows bias, hence hampered by SMB) can be found in:
http://www.ezlan.net/net_speed.html
http://www.ezlan.net/giga.html
http://www.hanselman.com/blog/WiringTheHouseForAHomeNetworkPart5GigabitThroughputAndVista.aspx
As per Scott Hanselman’s post,Jumbo frames can make a big difference in Gigabit performance, boosting throughput by as much as 100%.
These bus and network throughput values match up with rules of thumb I often see in the trenches. If you know of more thorough benchmarks corroborating or contradicting anything, please let me know. Thanks!
Great post Gustavo, keep up the good work!
The L2 cache can catch you out when working on large data structures. I remember when L2 caches were 4MB getting caught out scaling images for a texture mapped game. Once the images approached 4MB in size the performance dropped of a cliff. I know that now the GPU does a lot of this scaling and heavy-lifting for you but the principle when managing any large structure is the same.
This is a great compilation of memory hierarchy performance numbers. One word of caution though—you mix in the numbers for latency and bandwidth, which might lead a superficial reader to confuse the effect of the two. Bandwidth is the crucial one, because if it’s not adequate, there’s nothing you can do.
Latency, on the other hand, can be remediated: even though bad latency can kill a good bandwidth, caching/prefetching or amortization over large transfers can mask it out. Unfortunately, those techniques assume specific
data access patterns, and if those assumptions fail, latency becomes a problem. This leads to a circular trap in system design: the access pattern
has to be well characterized for a successful latency remediation, so that
only programs with ‘conforming’ access pattern run well on this system. Paradoxically, the better-optimized systems penalize weird and non-standard access patterns even more.
Gigabit Ethernet is a good example: 1 Gbps is a great peak bandwidth, but the actual practical bandwidth is much lower, due to relatively short packets (you quote 30 MBps instead of expected 100 megabytes/sec). The actual number for a stupid protocol (e.g. synchronous exchange of short packets) would be much smaller and probably not much faster than 100baseT, because it would have been dominated by packet send/receive latency.
Great post. Think I found a typo:
“Now, the front side bus bandwidth, ~10GB/s, actually looks decent. At that rate, you could read all of 8GB of system memory under 10 seconds or read 100 bytes in 10ns.” Shouldn’t that only take 1 second (or less) to read all of main memory, not 10s (in theory)?
The comment
“… but in reality their contribution is allowing a disk to queue up writes and then perform them in one bunch, thereby allowing the disk to plan the order of the writes in a way that – surprise – minimizes seeks. Reads can also be grouped in this way for performance, and both the OS and the drive firmware engage in these optimizations.”
Is misleading. Actually Native Command Queuing (NCQ) (the re-ordering to minimize seeks) is only available on certain hard drives (some SATA, SAS and SCSI). Also, NCQ improves performance when the disk requests are some what random. For example multiple users accessing different files on a network fileshare. It does not improve performance on desktop system that is running only one or two applications. In fact it might slow things down a bit because applications may be delayed by the optimization that minimizes seek times at the expensive of getting data to the application.
> Residential bandwidth still lags behind that of sustained
> hard drive reads, but the ‘network is the computer’ in a
> pretty literal sense now. What happens when the Internet
> is faster than a hard drive?
Perhaps not on a home PC, but in any datacenter worth the name, roundtrip to the next rack over is already faster than hitting disk. With lots of spindles (ie, database hosts) you can still get greater sustained throughput locally, but for very latency-sensitive applications it’s at the point now that the cheapest way to get 90 gigs of low-latency storage is a three hosts with 32G of RAM running memcached.
I don’t imagine it will be long before you can run applications out of S3 as fast as off your local disk. “Cloud computing” is a stupid term, but that doesn’t mean the underlying idea is wrong.
First I’d suggest labeling every number with Peak or observed, there’s a large difference. I’d also suggest any time you mention latency or bandwidth, that you mention the complimentary value as well. So if you mention 83ns of observed latency, mention both the observed bandwidth and the peak bandwidth (1333 MHz * 128 bits)=20.8GB/sec. For devices where random is significantly different than sequential access I’d suggest mentioning both numbers. So sequential and random for memory, and sequential and random for disk.
The throughput of 1 instruction per cycle is particularly bad, it can vary significantly higher and hugely lower based on what you are doing. Maybe mention the peak, and then the issue rate for a particular workload or benchmark?
Bandwidth would be interesting and useful for the caches.
FSB and RAM isn’t the same thing. They often run at different speeds, and of course the mentioned DDR is connected to the Northbridge not the FSB. So remove DDR3 from the FSB description.
For a real world memory bandwidth number I’d suggest McCalpin’s stream benchmark (ask google).
The PCI-e numbers you quote are for version 2.0, probably worth mentioning that. The usual PCI-e is 1/2 as fast.
If you are going to mention 83ns of memory latency, I’d mention the bandwidth as well (see stream above).
The disk again you should mention peak (from the specification for the drive) and observed. Keep in mind that reading say 1GB from a disk will vary often by a factor of 2 based on where you read the file. I bought a cheap 320GB disk drive gets 50MB/sec or so on the inside of the disk, and 115MB/sec on the outside.
GIG-e easily manages 90+ MB/sec, without Jumbo frames, of course that assumes an OS that does networking reasonably well. Linux does as do many others, you just have to be careful not to be disk limited.
If you need help collecting some of these numbers let me know.
Of course a related diagram for the Core i7 would be very interesting as well.
@b: Absolutely. 99% of the time you want the cleanest, simplest code you can possible write. In a few hotspots, which you discover by PROFILING the code rather than guessing, you optimize for performance if it’s really called for.
@Jason: When I looked for benchmarks, I found a lot of folks capping out at 30MB/s, 40MB/s for gigabit ethernet. Certainly though OS, protocol, and network gear makes a difference. Do you have some benchmarks handy for gigabit ethernet?
@lrbell: thanks for the suggestion. I’ll keep USB 3.0 in mind when it’s time to update this thing.
@SirPwn4g3: that’s cool, I have not been overclocking lately, but I used to enjoy it a ton. Just no time
@zenium: this conflicts with the knowledge I have regarding the buffering behavior of disks. I may well be wrong, but I’d appreciate if you could point me to some resources covering this stuff.
When it comes to apps being delayed, true if the OS is doing it, certainly there is room for different I/O scheduling strategies depending on usage, which is what the Linux kernel offers. But this does not apply to the write back cache since the disk accepts the writes immediately and then proceeds to do them in a seek-minimizing way.
@BB: yep, totally agreed. That’s why I said residential there, in a data center or even LAN there are a lot of interesting possibilities. I am into memcached and other RAM solutions as well.
@Dan: I’m going to mention this in the post. Do you have any idea of how average throughputs work out? Most of the benchmarks I found were well below 90MB/s. I’d love more benchmarks on this.
@Billamama: thanks for the suggestion. I’ll queue this up in the !ideas.txt here
@Mike: you might want to try some Sysinternals tools (now Microsoft tools since they were bought out). They shed light into a look of questions like this for Windows.
@Nick: totally ok with me. I have however posted a combined diagram, which I linked to in the last sentence of the article. Feel free to use my materials, I appreciate a link back though or mention of where it came from.
@kryzstoff: HAH, funny you should mention this I’m a Tufte fan and I had all sorts of fancy plans for the diagrams, for example I had thought of:
1. Making widths proportional to throughput. Maybe lengths.
2. Making the DISTANCES proportional to latency.
Given the brutal order-of-magnitude differences I experimented with a log scale and so on. But in the end, it looked like crap hahah and I don’t think it conveyed much So I went for simple simple. I’m sure a more talented person could come up with a way to make it work though.
@Filipe: hey, check the last paragraph, I have a link to the combined image
@Carlos: exactly, compression on the disk is definitely an interesting side effect of all this stuff.
@Sithdartha: It’s Consolas 9pt in Visio 2007. I also set Visio to “Higher quality text display” under Tools > Options > View.
@Bill: thank you for the suggestions. You make a number of good points, but I need to work some of the information in a way that still keeps the diagrams simple and readable. There are tradeoffs involved, some of which pertain to the target audience and the appropriate level of detail. I appreciate the offer for help, I may write you with a couple of question when I find some time to work on the blog.
Again, thanks everybody for all the kind comments and feedback. It’s great to be able to help out however minimally.
Take care.
Great article. I just want to part with these wise words:
Bandwith you can buy, latency is defined by nature.
Hi Alex,
Thanks a ton for the feedback.
That’s a good point you bring up. In a server environment with lots of tasks going on, it is true that you might have workloads that keep the CPU busy by a combination of multiple processes / decent balance between I/O and CPU usage.
In fact, top notch data centers always aim for that, to come up with workloads that keep the processor busy, since efficiency/money and efficiency/electricity is a big concern and idle hardware is money down the drain.
However, I often see servers where what you describe IS the case – the CPUs are always idling whereas the disks are very busy. Sometimes the server is dog slow – due to I/O – while the CPU is barely breaking 25% usage (one core out of four).
So I think modern systems _indeed_ became horribly inefficient. This million-cycle business is terrible. I think that’s why Jeremy Zawodny said the post “made him sad”.
We need to improve this. Maybe SSDs, maybe something else, but something’s gotta give. CPU stalls due to disk are now catastrophic.
Nice to see you again
Good article.
It matches other things I’ve been reading. This pyramid of latency and the corresponding trends will have a profound impact on how we program.
Here are some more pointers on recent computer trends: http://blog.monstuff.com/archives/000333.htmlIn particular, one of the direct consequences on the numbers you present above is that any large data processing needs to read from the disk sequentially (no seeks), like tapes. That’s the design behind Google MapReduce, Hadoop and Cosmos/Dryad: http://www.lexemetech.com/2008/03/disks-have-become-tapes.html
Computer Builders’ Friday – The “Core” Upgrade[...] Things to look out for You will want to make sure that the pin type matches between the motherboard and CPU. For instance, an LGA 1366 pin Core i7 CPU must be put onto a LGA 1366 pin motherboard. In terms of price point, be aware that small amounts of frequency increase (e.g. between 2.4GHz and 2.63GHz) are not worth the extra $$. A larger number of cores and amount of L2 cache, however, is worth it. Many know the benefits of quad and even hexa-core processors already, but L2 cache is the second-in-line memory bank your system hits and is about 20x less latency than regular DDR RAM (Gustavo Duarte). [...] Sphere: Related Content


+18.20.50.png)


 Blinklist.com